Webstory 3: Assimilation of TSCV data in a global ocean forecasting system
WS3: Assimilation of TSCV data in a global ocean forecasting system
An experiment assessing the impact of assimilating synthetic TSCV data in the Met Office global ocean forecasting system. The study demonstrates that assimilation of TSCV data has the potential to significantly improve our prediction of the ocean state.
Jennifer Waters
October 2022
1. Introduction
Observing System Simulation Experiments (OSSEs) are used to assess the impact of assimilating potential Total Surface Current Velocities (TSCV) in the Met Office global ocean forecasting system (FOAM). Synthetic observations are generated from a Nature Run (NR) which is a high-resolution model run. We generate synthetic observations for all standard observation types as well as new observations expected from a potential TSCV satellite mission. These synthetic observations are then assimilated into FOAM to assess the impact of TSCV assimilation.
2. Experiment Design
We compare two OSSEs to assess the performance of the TSCV assimilation; a control experiment and a TSCV assimilation (A-TSCV) experiment. Table 1 provides a summary of the NR and OSSEs. The control experiment is designed to closely emulate our standard FOAM system. It assimilates synthetic observations for all standard observation types; sea surface temperature (SST), in-situ temperature (T) and salinity (S) profiles, sea surface height (SSH) and sea ice concentration (SIC). Realistic observation errors are added to the simulated observations for standard observation types. The A-TSCV is identical to the control but assimilates the additional simulated TSCV observations. In the presented A-TSCV experiment the simulated TSCV observations only include a mapping error which is approximately 2cm/s (instrument error is not included).
| Experiment | Resolution | Fluxes | Assim SST | Assim T/S profiles | Assim SSH | Assim SIC | Assim TSCV |
|---|---|---|---|---|---|---|---|
| NR (Nature run) | 1/12° | ECMWF IFS | |||||
| Control | 1/4° | ERA5 | ✔ | ✔ | ✔ | ✔ | |
| A-TSCV | 1/4° | ERA5 | ✔ | ✔ | ✔ | ✔ | ✔ |
Table 1: Overview of the experiment set up. The ECMWF IFS fluxes are from the ECMWF operational system, the ERA5 fluxes are described in Hersbach et al (2017).
The data assimilation system in FOAM includes multivariate balances and these are represented through a series of linearised balance relationships. In the control experiment, corrections are only made to the velocities through the geostrophic balance and this balance is not applied close to the equator. In the A-TSCV experiment both geostrophic and ageostrophic corrections are made to the velocities and furthermore, the geostrophic component gets transferred to the other variables though the balance relationships.
3. Results
In our OSSEs the NR can be considered the truth and is used to verify the experiments. In Figure 1 we show the global RMSE (mean error) for T, S, zonal velocity (U), meridional velocity(V) and SSH. We see a significant reduction in global RMSE for the A-TSCV experiment for U, V and T both at the surface and at depth. We also see smaller improvements in S and a 2cm reduction in the RMSE for SSH. The results demonstrate significant improvement to the global statistics in our OSSEs when TSCV data are assimilated.
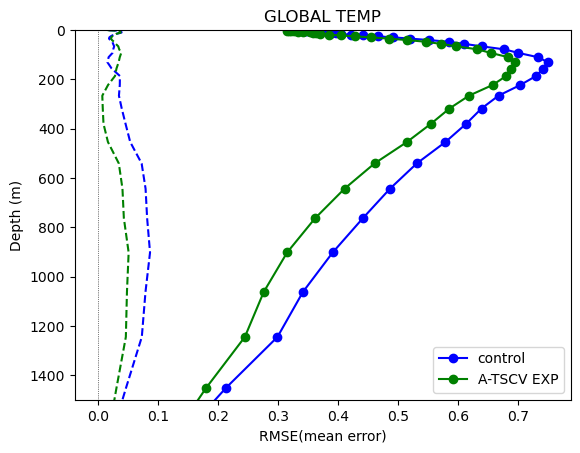
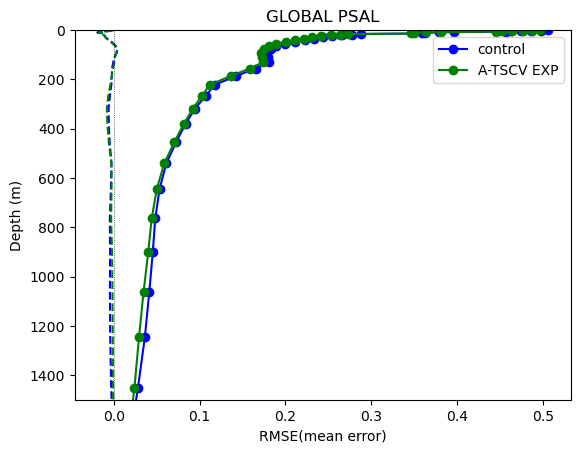
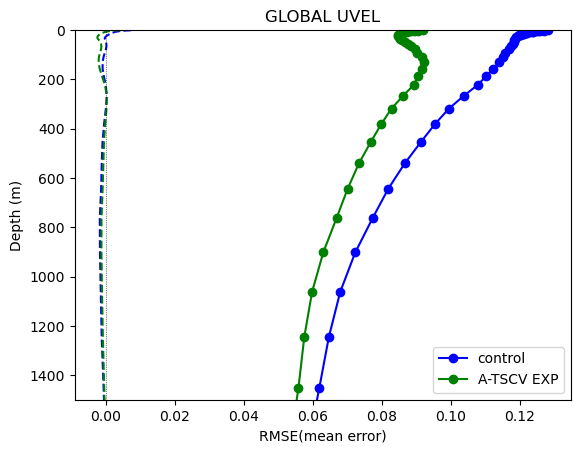
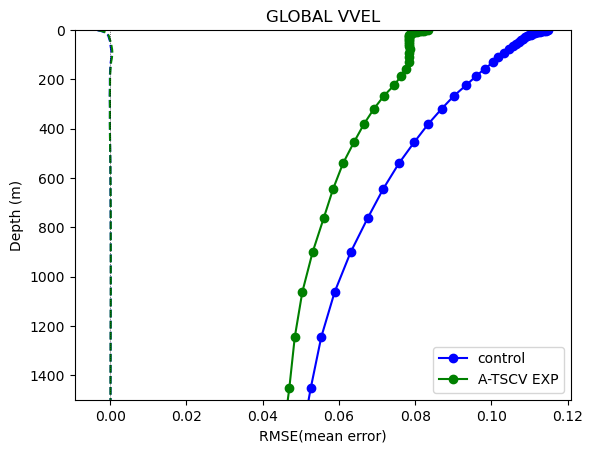
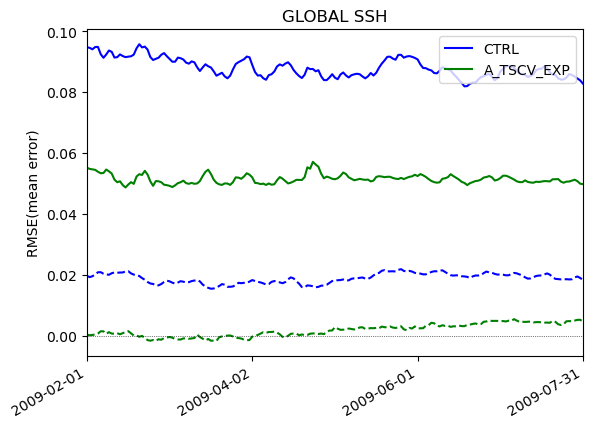
Figure 1: Global RMSE (solid line) and Mean Error (dashed line) for T, S, U and V profiles and SSH time series calculate between the 1st of February and 31st of July 2009. Blue is the control experiment, green is the A-TSCV experiment.
Figure 2 shows the difference in surface U RMSE for the control and A-TSCV experiment for July 2009. This figure demonstrates the spatial distribution of the global U RMSE improvements in the A-TSCV experiment. When TSCV data is assimilated we can see that the RMSE is reduced in the in the Western Boundary Currents, in the Antarctic Circumpolar Current (ACC) and in the equatorial region.
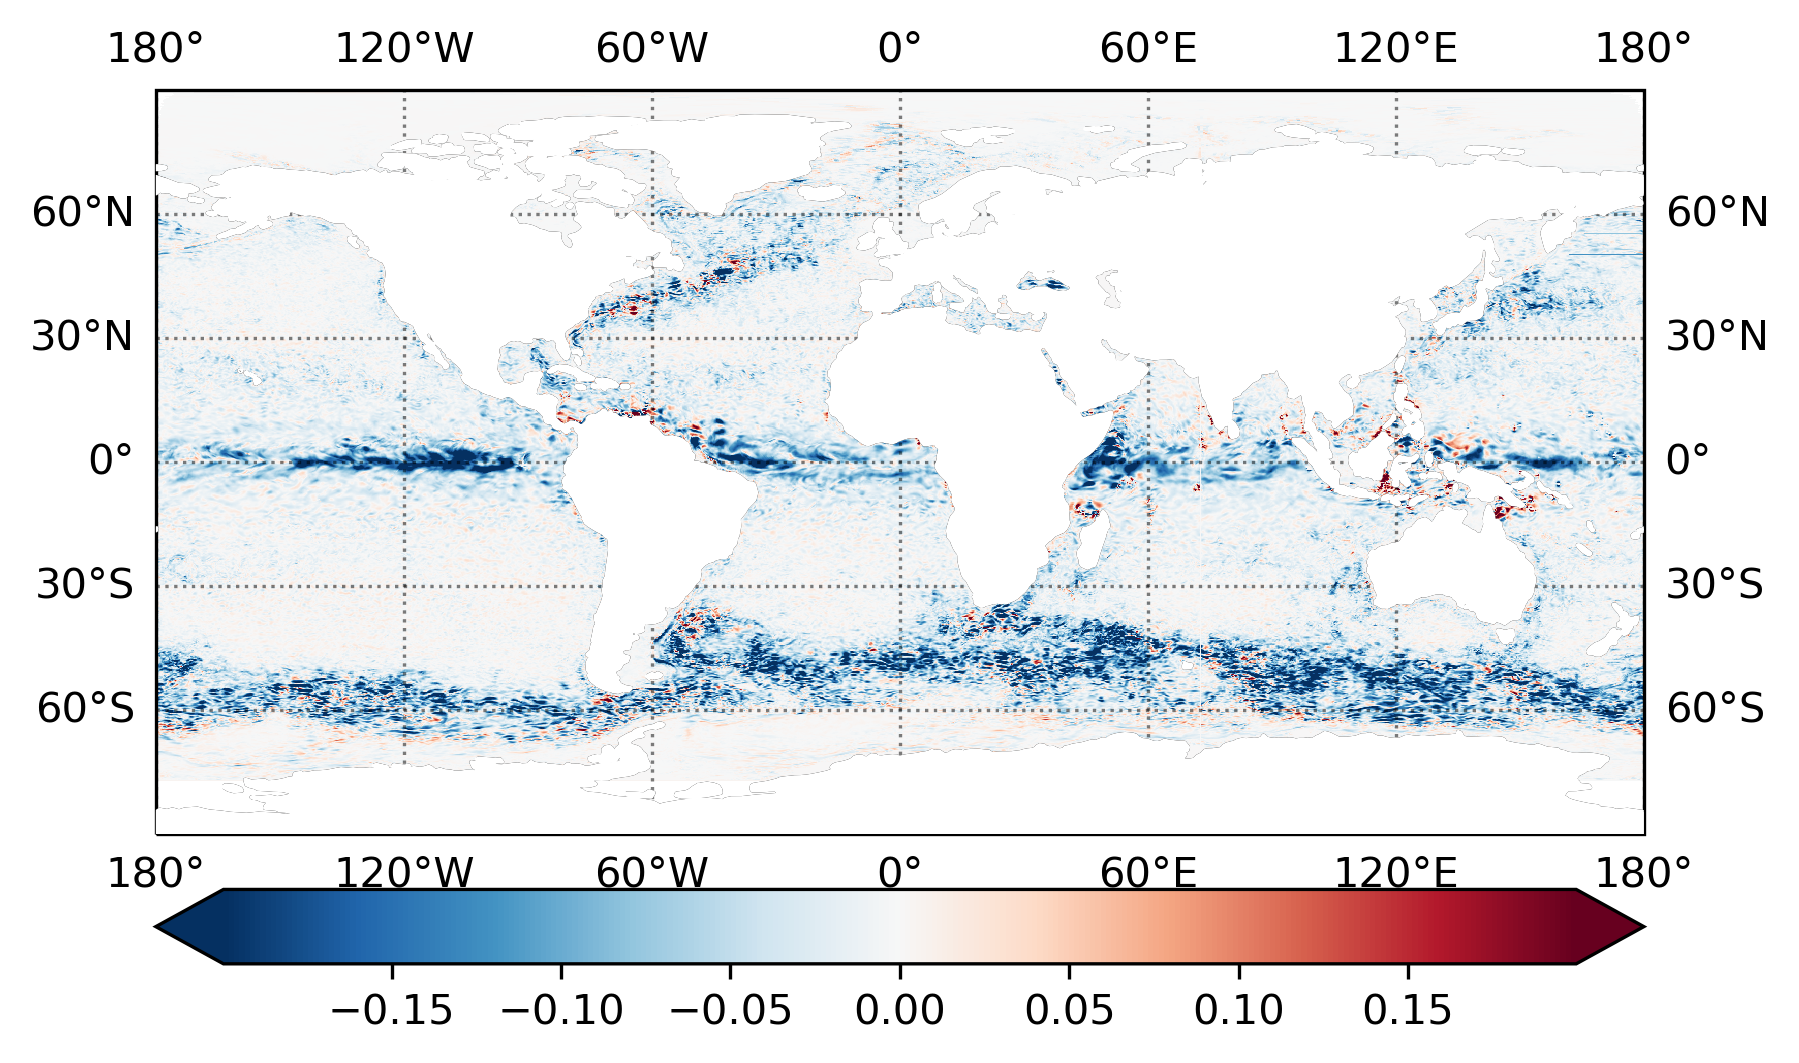
Figure 2: Difference in the surface zonal velocity RMSE for the control and A-TSCV experiments calculated for July 2009. Blue shows regions where the A-TSCV experiment had a lower RMSE than the control while red shows regions where the A-TSCV experiment has a higher RMSE.
The improvement in the RMSE for the A-TSCV experiment is also well retained in the forecast. Figure 3 shows the global surface U RMSE as a function of forecast lead time. The relative improvement in the RMSE for the A-TSCV experiment compared to the control is well retained throughout the 7-day forecast. This suggests that the assimilation of TSCV data could produce a significant improvement to forecast skill.
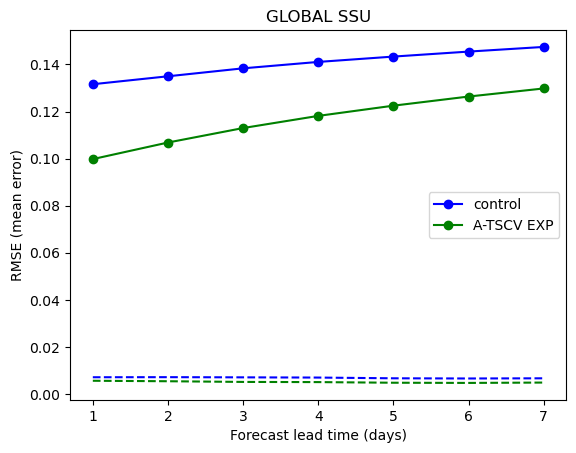
Figure 3: Global surface zonal velocity RMSE (mean) for the control and A-TSCV experiments as a function of forecast lead time. The statistics were calculated by running 7 day forecasts every 7 days between February and December 2009 to produce a total of 47 forecasts. Blue is the control experiment, green is the A-TSCV experiment.
4. Conclusions
An experiment testing the assimilation of simulated TSCV observations demonstrates that the TSCV data has the potential to significantly improve ocean predictability throughout the water column. The main improvements are seen in the eddy-rich regions of the Western Boundary Currents and ACC and in the equatorial region. These improvements are shown to persist throughout a 7-day forecast.
This study demonstrates an idealised experiment set up where the simulated TSCV data has a small and uncorrelated observation error. In reality, we expect the real TSCV observation to have larger, correlated observation errors and we anticipate that this will reduce some of the benefit of the assimilation. The impact of specifying more realistic observation errors for the TSCV data will be accessed in future experiments. Nevertheless, this study establishes that there are potentially significant benefits to assimilating good quality velocity data in our global ocean forecasting system.
References
Blockley, E. W. et al. (2014). Recent development of the Met Office operational ocean forecasting system: an overview and assessment of the new Global FOAM forecasts, Geoscience Model Development, 7, 2613-2638, https://doi.org/10.5194/gmd-7-2613-2014
Hersbach, H., Bell, B., Berrisford, P., Hirahara, S., Horányi, A., Muñoz‐Sabater, J., Nicolas, J., Peubey, C., Radu, R., Schepers, D., Simmons, A., Soci, C., Abdalla, S., Abellan, X., Balsamo, G., Bechtold, P., Biavati, G., Bidlot, J., Bonavita, M., De Chiara, G., Dahlgren, P., Dee, D., Diamantakis, M., Dragani, R., Flemming, J., Forbes, R., Fuentes, M., Geer, A., Haimberger, L., Healy, S., Hogan, R.J., Hólm, E., Janisková, M., Keeley, S., Laloyaux, P., Lopez, P., Lupu, C., Radnoti, G., de Rosnay, P., Rozum, I., Vamborg, F., Villaume, S., Thépaut, J-N. (2017): Complete ERA5 from 1979: Fifth generation of ECMWF atmospheric reanalyses of the global climate. Copernicus Climate Change Service (C3S) Data Store (CDS).